
LythosFEA — examples
Every output and figure is from a real run.
1. A slope factor of safety — Python script
A 10 m high 2H:1V cut in silty clay (c′ = 10 kPa, φ′ = 20°, γ = 20 kN/m³):
from lythos.core.materials import MohrCoulomb
from lythos.core.model import Model, SoilLayer, Stage
from lythos.report import run_and_report

clay = MohrCoulomb(name="silty clay", E=1e5, nu=0.3, c=10.0, phi=20.0, gamma=20.0)
slope = [(0, 0), (40, 0), (40, 10), (25, 10), (5, 0)]

model = Model(
    name="cut slope",
    layers=[SoilLayer("silty clay", slope, clay, mesh_size=2.0)],
    stages=[
        Stage("1 - self weight", kind="initial"),
        Stage("2 - factor of safety", kind="ssr"),
    ],
    initial_stress="gravity",
)

summary = run_and_report(model, out_dir="out/slope")
print(summary["stages"][-1]["factor_of_safety"])report written to out/slope/report.html
1.414run_and_report writes a self-contained HTML report with every figure embedded, and the numbers as JSON (mesh.png, stage2_deviatoric_strain.png, stage2_ssr.png, summary.json …). The SSR curve plots displacement against the reduction factor; equilibrium holds at 1.414 and displacements run away beyond it:
SRF    0.80   1.25   1.375  1.406  1.414  1.422  1.438   1.50
u mm 0.0 1.33 4.42 9.81 18.45 19.10 55.97 125.60An independent Bishop search on the same slope gives 1.377; on a fine mesh SSR converges to 1.381 (see validation). The 1.414 here comes from a coarse mesh_size = 2.0 — refine the mesh and watch the factor of safety converge.
Running from an editor
examples/thonny_analysis.py (the whole analysis as plain Python) and examples/thonny_gui.py (starts the interface) are written to be opened in Thonny, IDLE or VS Code and run with Run.
2. An anchored deep excavation — command line
Write the built-in examples as model files and run the excavation:
lythos examples -o models          # slope, embankment, pile_wall, excavation
lythos mesh models/slope.json      # mesh statistics, without analysing
lythos run models/excavation.json -o out/excavation
The model: stiff clay over dense sand with 8 m of sand fill on top; a D1000 @ 1.2 m bored pile wall; two rows of anchors prestressed to 350 and 450 kN; a 20 kPa site surcharge; three excavation lifts.
mesh: 1250 elements, 2651 nodes, 5325 degrees of freedom
  stage 1/6: 1 - initial stresses
  stage 2/6: 2 - install wall
  stage 3/6: 3 - excavate to 27.0 m
  stage 4/6: 4 - stress anchor row 1, excavate to 24.0 m
  stage 5/6: 5 - stress anchor row 2, excavate to 22.0 m
  stage 6/6: 6 - factor of safety
      trial SRF 0.800: equilibrium found, 71.6 mm, 8 iterations, 0.2 s
      trial SRF 1.100: equilibrium found, 71.6 mm, 37 iterations, 2.2 s
      trial SRF 1.550: equilibrium found, 119.6 mm, 90 iterations, 7.3 s
      trial SRF 2.050: no equilibrium, 4748.2 mm, 594 iterations, 46.2 s
      trial SRF 1.800: equilibrium found, 227.0 mm, 50 iterations, 3.4 s
      trial SRF 1.925: equilibrium found, 327.3 mm, 44 iterations, 2.9 s
      trial SRF 1.988: equilibrium found, 426.5 mm, 46 iterations, 3.4 s
      trial SRF 2.019: equilibrium found, 712.4 mm, 47 iterations, 3.6 s
      trial SRF 2.034: equilibrium found, 1739.0 mm, 356 iterations, 34.8 s
      trial SRF 2.042: no equilibrium, 1739.1 mm, 430 iterations, 45.2 s
report written to out/excavation/report.html
lowest factor of safety: 2.034
summary.json gives the wall forces and anchor loads stage by stage:
| Stage | Max. displacement | Wall max. M | Wall deflection | Anchor 1 | Anchor 2 |
|---|---|---|---|---|---|
| 2 — wall | 15.5 mm | 28 kNm/m | 3.0 mm | — | — |
| 3 — dig to 27.0 m | 34.1 mm | 83 kNm/m | 10.0 mm | — | — |
| 4 — anchor 1, 24.0 m | 59.3 mm | 164 kNm/m | 16.8 mm | 350.0 kN | — |
| 5 — anchor 2, 22.0 m | 71.6 mm | 219 kNm/m | 20.8 mm | 305.8 kN | 450.0 kN |
| 6 — SSR | FS = 2.034 |
With a moment capacity of 1 257 kNm/m, the utilisation at the last stage is 0.174. When the second anchor is stressed, the first row relaxes from 350 to 306 kN — an interaction only a staged analysis can show.
3. A construction sequence from a CAD drawing
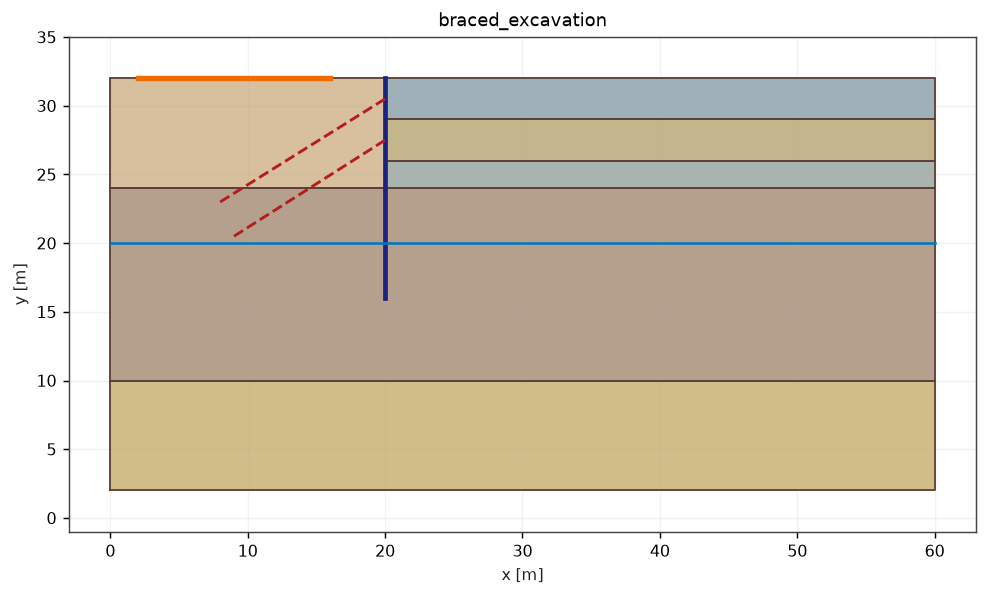
lythos import --sample -o excavation.json
# or your own drawing:
lythos import section.dxf -o section.json --plot section.png layer 'ANCHOR-3' -> anchor
layer 'ANCHOR-5' -> anchor
layer 'DIM-LEVELS' -> ignored
layer 'EXC-2' -> excavation
layer 'EXC-4' -> excavation
layer 'EXC-6' -> excavation
layer 'SOIL-DENSE-SAND' -> soil
layer 'SOIL-FILL' -> soil
layer 'SOIL-STIFF-CLAY' -> soil
layer 'SURCHARGE-1' -> load
layer 'TEXT-NOTES' -> ignored
layer 'WALL-1' -> structure
layer 'WATER-TABLE' -> water
soil region 'SOIL-DENSE-SAND': 480.00 m2
soil region 'SOIL-STIFF-CLAY': 840.00 m2
...
step 1: build WALL-1; apply SURCHARGE-1
step 2: excavate EXC-2
step 3: stress ANCHOR-3
step 4: excavate EXC-4
step 5: stress ANCHOR-5
step 6: excavate EXC-6
warning: line loads were imported with zero magnitude; set q before running
warning: 3 region(s), 320.0 m2 in all, are excavated by the end of the sequence. ...That becomes an eight-stage model: initial stresses, the six steps and a factor of safety. A number at the end of a layer name is the step at which that thing happens — that is the whole convention. The drawing fixes the geometry and nothing else; soil properties, section sizes and load magnitudes are set afterwards (the warnings say so). Rules: DXF import.
4. A pile wall section
Piles are given the way they are designed, and the equivalent plate rigidities follow:
from lythos.core.pile import PileSection

piles = PileSection(diameter=1.0, spacing=1.2, fck=32.0,
                    rho_s=0.012, stiffness_factor=0.7)   # 0.7 for cracked bending
print(piles.describe()){'name': 'pile', 'diameter_m': 1.0, 'spacing_m': 1.2, 'fck_MPa': 32.0,
'E_kPa': 33345764.46, 'area_m2': 0.7854, 'inertia_m4': 0.04909,
'EA_kN_per_m': 21824751.8, 'EI_kNm2_per_m': 954832.9,
'weight_kN_per_m2': 16.36, 'Mp_kNm_per_m': 1256.6}The concrete modulus comes from EN 1992-1-1 (Ecm = 22000·(fcm/10)0.3 MPa). All structural output is per metre run of wall; divide by the spacing (1.2 m) for the force in one pile.